With 64.5% of pizza operators expecting higher profit margins in 2026, the industry feels more vibrant and competitive than ever. You likely started your journey with a deep passion for the perfect crust and a commitment to authentic family recipes. However, you've probably realized that rising ingredient costs and high staff turnover can quickly erode those dreams. Balancing the artistry of a handmade pie with the cold reality of a balance sheet is the ultimate challenge for any ambitious owner. To thrive, you need a precise set of key performance indicators for a pizza restaurant that protect your heritage while fueling your growth.
We've spent over 30 years refining a data-driven model that honors Italian tradition without sacrificing operational excellence. This guide promises to help you master the essential metrics that bridge the gap between artisanal quality and modern financial performance. We will walk you through a clear dashboard of metrics designed to improve your bottom line and create a framework for scaling to multiple units. From optimizing labor costs to perfecting order accuracy, you're about to discover how to turn your passion into a predictable, profitable legacy.
Key Takeaways
- Identify the vital signs of business health by monitoring the essential key performance indicators for a pizza restaurant to ensure long-term stability.
- Optimize your kitchen workflow by balancing authentic craftsmanship with rigorous labor cost percentages and high order accuracy rates.
- Protect your profit margins through a strategic "Heritage Ratio" that balances premium imported ingredients with efficient local sourcing.
- Leverage customer satisfaction metrics like Net Promoter Score to drive long-term loyalty and increase the lifetime value of every guest.
- Build a foundation for successful expansion by benchmarking your daily performance against proven, data-driven franchise standards.
Essential Financial KPIs: Tracking the Pulse of Your Pizzeria
Excellence in the kitchen must be matched by precision in the back office. While your guests focus on the aroma of fresh basil and the stretch of premium mozzarella, your success depends on your ability to read the numbers behind the scenes. A performance indicator serves as a vital sign for your business health. It acts as a diagnostic tool that tells you exactly where your operation is thriving and where it may be losing blood. For any owner, mastering key performance indicators for a pizza restaurant is the first step toward transforming a single kitchen into a scalable legacy.
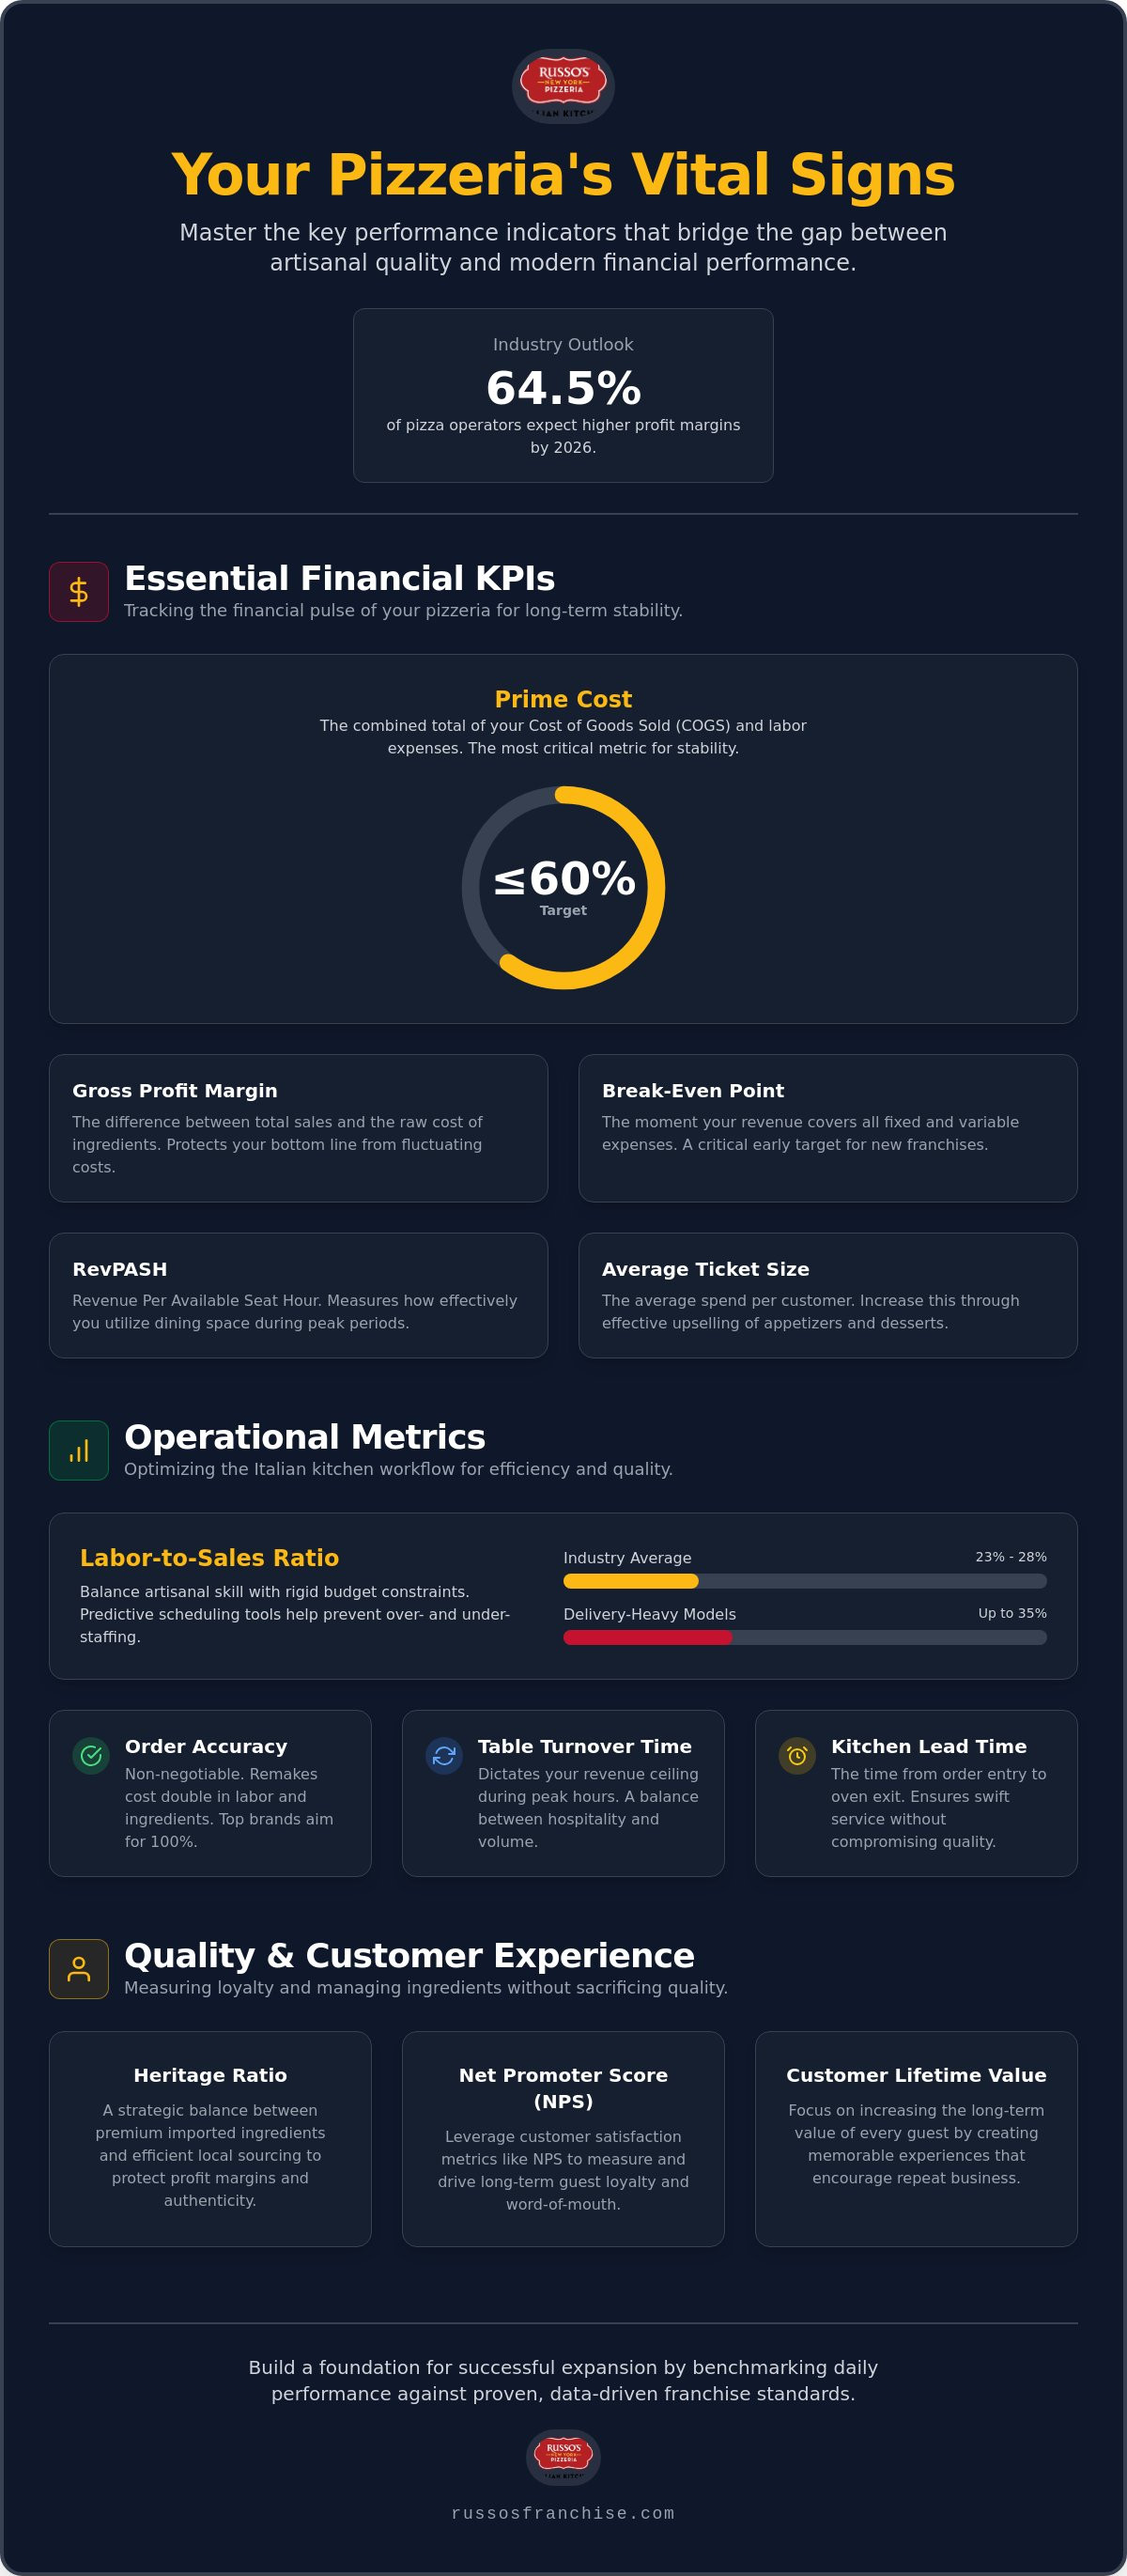
Your primary focus should always remain on your Gross Profit Margin. This metric represents the clear air between your total sales and the raw cost of your ingredients. In an era where ingredient costs fluctuate, protecting this margin is how you maintain the integrity of your menu without sacrificing your bottom line. For those launching a new franchise location, the Break-Even Point is your most critical early target. It defines the exact moment your revenue covers every fixed and variable expense. Knowing this number provides the entrepreneurial confidence needed to navigate the early months of a new venture.
Stability is further anchored by your Prime Cost. This is the combined total of your Cost of Goods Sold (COGS) and your labor expenses. In a healthy, disciplined pizzeria, you should aim for a Prime Cost of 60% or less. If this figure begins to creep upward, it often indicates waste in the kitchen or inefficiency in your scheduling. Monitoring this daily allows you to make swift, informed adjustments before a minor leak becomes a flood.
Revenue Per Available Seat Hour (RevPASH)
Maximizing the potential of your dining room requires more than just a full house. RevPASH helps you understand how effectively you utilize your space during those critical peak periods. By calculating this metric, you can determine if your Friday night rushes are actually as profitable as they look. The quick-serve nature of authentic New York-style pizza is a massive advantage here. High seat turnover allows you to serve more guests in less time, significantly boosting your revenue per hour compared to slower, traditional dining models.
Average Ticket Size and Upselling Success
Ticket size is the primary lever for immediate revenue growth. By tracking the average spend per customer across both dine-in and takeout orders, you gain a clear view of your team's upselling effectiveness. Encouraging guests to add "Italian Kitchen" specialties, such as handmade appetizers or signature desserts, does more than just increase the bill. It rounds out the dining experience. A well-trained staff that can naturally suggest a perfect pairing or a family-style starter can drive significant gains in profitability without requiring a single new customer to walk through the door.
Operational Metrics: Optimizing the Italian Kitchen Workflow
Operational precision is the bridge between a family recipe and a profitable enterprise. While the financial pulse tells you if the business is alive, operational metrics tell you how efficiently it is running. In 2026, the industry average for labor costs typically sits between 23% and 28% of sales. For delivery-heavy models, this figure often climbs to 35%. Balancing the artisanal skill of a master pizza tosser with these rigid budget constraints requires a disciplined approach to scheduling. Maintaining precise key performance indicators for a pizza restaurant allows you to spot inefficiencies in your workflow before they impact your reputation.
Order accuracy is a non-negotiable metric for growth. In 2026, top-performing brands like Marco's Pizza achieved 100% order accuracy, setting a high bar for the industry. Every "remake" is a double blow to your profitability, consuming twice the labor and twice the ingredients for a single sale. Beyond the kitchen, your table turnover time dictates your ceiling for revenue during peak hours. It is a delicate dance between warm hospitality and high-volume throughput. By measuring kitchen lead time, the vital minutes from order entry to the final oven exit, you can ensure that your service remains swift without compromising the integrity of a hand-crafted pie.
Labor-to-Sales Ratio and Predictive Scheduling
Predictive scheduling has evolved significantly. Modern AI tools now forecast staffing needs by analyzing historical data and local event calendars to prevent the twin traps of over-staffing and under-staffing. Over-staffing quietly drains your weekly profit, while under-staffing causes irreparable damage to your brand through slow service and stressed employees. The Russo's streamlined kitchen model is designed to maintain a lean labor ratio, ensuring that every team member provides maximum value during the busiest shifts. For those looking to bypass the trial-and-error of independent management, exploring a franchise opportunity provides access to these advanced operational systems from day one.
Inventory Turnover and Waste Tracking
High inventory turnover is a primary health indicator for any Italian kitchen, particularly regarding fresh dough and premium dairy. Ingredients should move through your kitchen, not sit in your cooler. To maintain high standards, you must track the variance between "Theoretical vs. Actual" food costs. This process identifies specific key performance indicators related to portion errors or theft. Waste tracking directly impacts the bottom line by uncovering the hidden costs of kitchen errors and ensuring your premium ingredients are sold, not discarded.
- Daily Waste Log: Record every dropped dough ball or burnt crust to identify training gaps.
- Portion Control: Use standardized scales to ensure consistency across every station.
- AI Forecasting: Use 2026 digital tools to align your prep lists with expected order volume.
Ingredient Integrity: Managing COGS Without Sacrificing Quality
Heritage isn't just a marketing story; it's a deliberate financial strategy. In a premium Italian kitchen, the "Heritage Ratio" represents the delicate balance between high-cost imported staples, like extra virgin olive oil or aged balsamic, and high-quality local produce. Managing key performance indicators for a pizza restaurant requires you to view ingredients as investments rather than just expenses. While "cheap" ingredients might offer a temporary boost to your margins, they often lead to high customer churn. True profitability comes from the consistent, superior taste that keeps guests returning week after week.
A standard large pizza's Cost of Goods Sold (COGS) is a composite of several variables. Flour, cheese, and sauce form the foundation, but your yield management determines the final profitability of every pie. You must track exactly how many dough balls a single bag of premium flour produces and how many ounces of cheese are distributed across every station. Yield management is the silent protector of your profit. It ensures that your high-quality inputs aren't lost to over-portioning or kitchen errors. When you control these variables, you protect the premium nature of your brand without eroding your bottom line.
Premium Ingredient Cost Management
Maintaining healthy margins while using authentic family recipes requires a sophisticated approach to procurement. Independent owners often struggle with price volatility in global markets. However, a structured franchise model utilizes significant bulk-buying power to stabilize COGS for individual owners. This stability is especially vital when navigating specialized segments, such as the halal pizza franchise model. Tracking the impact of halal-certified ingredient sourcing allows you to tap into growing global markets while maintaining the rigorous quality standards that define a premium Italian experience.
The Economics of Scratch-Made Dough
The choice between scratch-made and frozen dough is a fundamental business decision. While frozen dough might seem to reduce labor, it carries a higher product cost and lacks the distinct texture that drives repeat business. Scratch-made dough is the soul of the kitchen. It requires more skilled labor, but the significantly lower ingredient cost and superior quality offer a far better long-term ROI. Many investors look for pizza franchise opportunities precisely because they value this commitment to quality. You can measure this success through a "Quality Score" derived from customer feedback on your crust and sauce, ensuring your operational choices align with guest expectations.
- The 80/20 Rule: Focus on the 20% of ingredients that make up 80% of your food cost.
- Waste Reduction: Implement daily inventory counts for high-value items like premium meats and cheeses.
- Supplier Audits: Regularly review supplier performance to ensure consistency in both price and ingredient grade.
Customer Experience & Growth: Measuring Loyalty in a Digital Age
A successful pizzeria thrives on the strength of its community. While financial and operational data provide the structure, guest sentiment provides the soul of the business. The Net Promoter Score (NPS) remains the gold standard for measuring this emotional connection. It quantifies how likely your guests are to recommend your kitchen to their own inner circles. Research indicates that brands improving their customer satisfaction scores by just 2% to 3% can see revenue uplifts as high as 119%. This isn't just about a single meal. It's about building a predictable growth engine fueled by word-of-mouth and deep-rooted brand trust.
In 2026, loyalty is also tracked through digital engagement and review sentiment analysis. You must look beyond simple star ratings to understand the "why" behind the numbers. Tools that scan Google and Yelp reviews for recurring themes allow you to address specific operational gaps before they become systemic issues. This data-driven approach to hospitality ensures your key performance indicators for a pizza restaurant reflect the actual guest experience across every channel. By comparing your Customer Acquisition Cost (CAC) against the Customer Lifetime Value (CLV), you can determine exactly how much you can afford to invest in reaching new guests while keeping your current ones satisfied.
Loyalty Program Participation Rates
Repeat customers are the lifeblood of the industry. They generate approximately 71% of sales for quick-service restaurants and are five times cheaper to serve than new acquisitions. Measuring the redemption rate of your digital offers helps you understand which incentives actually drive foot traffic and which ones are ignored. This level of granular data is a cornerstone of any italian kitchen franchise expansion strategy. It proves the concept's viability and emotional resonance in new territories before you even break ground.
Delivery Service Level Agreements (SLAs)
Delivery is a primary revenue stream that requires strict Service Level Agreements. You must monitor "Driver Out-to-Door" times with absolute precision to protect the integrity of your product. Data shows that pizzas arriving warm boost overall customer satisfaction by more than 53 percentage points. While third-party delivery apps provide reach, their high fees can cannibalize your net profitability per order. Encouraging first-party ordering through your own digital platforms allows you to own the customer data and the full margin of every sale. If you're ready to build a business backed by 30 years of guest loyalty data, consider a franchise opportunity that prioritizes both heritage and high-tech efficiency.
- NPS Tracking: Send short, automated surveys immediately after a guest dines or receives a delivery.
- Sentiment Analysis: Use 2026 AI tools to categorize feedback into "Food Quality," "Service Speed," and "Staff Friendliness."
- App Engagement: Monitor how often loyalty members open your app versus how often they complete a purchase.
Scaling with Russo’s: How Franchise Data Drives Success
Success in the pizza industry isn't just about the hours you spend in the kitchen; it's about the precision of your strategy. Many independent owners find themselves buried in the daily grind. They struggle to see the broader financial picture while managing the oven. Joining a proven system changes that dynamic. It provides a "Proven Blueprint" for financial and operational tracking that eliminates the guesswork. By monitoring key performance indicators for a pizza restaurant within a structured network, you gain the ability to benchmark your results against the top 10% of performers. This comparison reveals exactly where you can tighten operations or expand your reach to maximize profitability.
Scaling an authentic brand across borders requires more than just family recipes. It demands global data standardization. Our international master franchise model ensures that whether you're in Houston or Riyadh, the metrics for success remain consistent and clear. Centralized reporting allows you to identify multi-unit growth opportunities with surgical precision. You can see which territories have the highest demand and where your margins are most protected. This high-level view is what allows a single-unit operator to evolve into a regional powerhouse.
Franchise Support and Data Mentorship
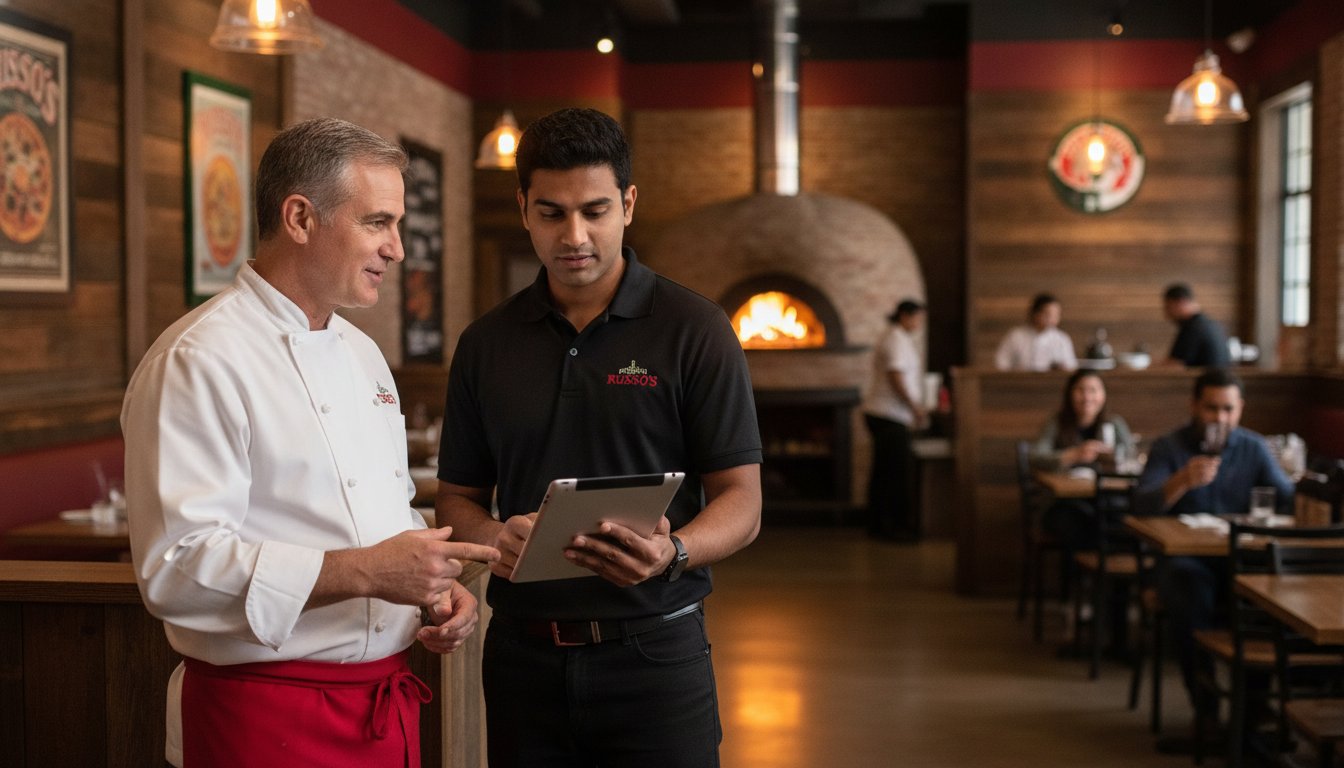
The transition from "working in the business" to "working on the business" is the hallmark of a successful entrepreneur. Russo’s field consultants act as seasoned mentors. They help you interpret your KPIs to ensure you're getting the best possible ROI. For instance, our halal pizza franchise partners use specific demographic and purchasing data to win local markets. They don't just guess what their community wants; they use data to prove it. This mentorship ensures you aren't just an owner, but a disciplined business leader with a clear path to growth.
Your Next Steps Toward Pizzeria Ownership
Entering the world of premium Italian dining requires careful due diligence. Reviewing the Franchise Disclosure Document (FDD) is essential for full financial transparency. It provides the hard numbers you need to make an informed investment. We also encourage potential partners to look at pizza franchise comparison charts to see how our commitment to quality translates into long-term stability. Your ambition deserves a proven foundation. Contact Russo's today to see how our data-driven model and 30-year legacy can support your journey toward successful pizzeria ownership.
- Benchmarking: Compare your monthly performance against the network's highest earners.
- Centralized Reporting: Access real-time data from all your locations through a single dashboard.
- Strategic Growth: Use historical data to determine the ideal timing for your next location.
Building Your Legacy with Data-Driven Heritage
Success in the 2026 pizza market requires a steadfast commitment to both the craft of the kitchen and the precision of the spreadsheet. You've seen how mastering the key performance indicators for a pizza restaurant can transform thin margins into robust profitability. By balancing your "Heritage Ratio" with rigorous operational metrics and customer loyalty data, you create a business that's as stable as it is authentic. The path to scaling a multi-unit empire is paved with these insights; they allow you to protect your quality while expanding your footprint.
Chef Anthony Russo has led this brand since 1992. He's proven that authentic family recipes can thrive within a sophisticated global footprint. Our model offers proven margins through premium ingredients and a structured framework for master franchise opportunities across the world. You don't have to navigate these complexities alone. We provide the mentorship and the blueprint required to turn your entrepreneurial ambition into a lasting professional achievement. Start Your Journey with Russo's New York Pizzeria Today and discover how our history can secure your future. Your vision for a premier Italian kitchen is within reach.
Frequently Asked Questions
What is the most important KPI for a new pizza restaurant?
The Break-Even Point is the most critical metric for any new location during its initial months of operation. It identifies the exact revenue level needed to cover every fixed and variable expense, from rent to raw ingredients. Monitoring this daily provides the entrepreneurial confidence required to navigate the early stages of a new venture. Once you reach this milestone, your focus should naturally shift toward Gross Profit Margin to ensure long-term stability.
How do I calculate the food cost percentage for my pizzeria?
You calculate food cost percentage by dividing the total cost of ingredients used by your total sales for a specific period. To find your usage cost, take your beginning inventory, add new purchases, and subtract your ending inventory. This figure is a vital part of the key performance indicators for a pizza restaurant . It helps you identify if portions are too large or if ingredient waste is eroding your monthly margins.
What is a good labor cost percentage for a pizza franchise in 2026?
A healthy labor cost percentage for a pizzeria in 2026 typically falls between 23% and 28% of total sales. If your business model relies heavily on delivery, this figure might climb toward 35% due to additional driver payroll and logistics. The key is to use predictive scheduling tools to align your staff levels with historical peak demand. This disciplined approach ensures you maintain high service standards without overspending on unnecessary hours.
How does seat turnover impact the profitability of an Italian kitchen?
High seat turnover directly increases your Revenue Per Available Seat Hour by allowing you to maximize the earning potential of your physical space. The quick-serve nature of authentic New York-style pizza is particularly effective for this metric. It facilitates a faster dining experience that satisfies guests while keeping your tables open for the next party. This rhythm boosts your daily throughput and ensures your dining room remains a vibrant, high-performing asset.
Can I track KPIs without expensive POS software?
You can track metrics manually using spreadsheets, though it requires significant time and meticulous daily record-keeping. Simple logs for kitchen waste, labor hours, and sales totals can provide a basic foundation for financial analysis. However, as you scale toward multiple units, automated systems become essential for maintaining accuracy. They provide real-time data that allows you to make swift adjustments, which is much harder to achieve through manual entry alone.
How often should I review my restaurant's performance metrics?
You should review core metrics like labor costs and daily sales every single day to catch immediate inefficiencies. Weekly reviews are ideal for analyzing food cost variances and inventory turnover rates. Finally, a comprehensive monthly audit allows you to see broader trends in customer loyalty and net profitability. Consistent review ensures that small operational leaks are caught and repaired before they impact your brand's overall financial health or prestige.
What is the difference between theoretical and actual food costs?
Theoretical food cost is what your expenses should be if every dish was prepared with perfect portions and zero waste. Actual food cost is the reality of what you truly spent on ingredients during a specific period. The gap between these two numbers reveals hidden profit killers like over-portioning, theft, or kitchen errors. Identifying this variance is a fundamental step in mastering the key performance indicators for a pizza restaurant and protecting your bottom line.
How do Russo's franchise owners receive help with their financial tracking?
Russo's franchise owners receive dedicated support through our specialized field consultants and sophisticated centralized reporting tools. We provide a proven blueprint for tracking every vital metric, from ingredient yield to labor efficiency. This mentorship helps you transition from working in the kitchen to working on the business as a strategic leader. Our data-driven systems take the guesswork out of management, allowing you to focus on maintaining our high standards of quality.